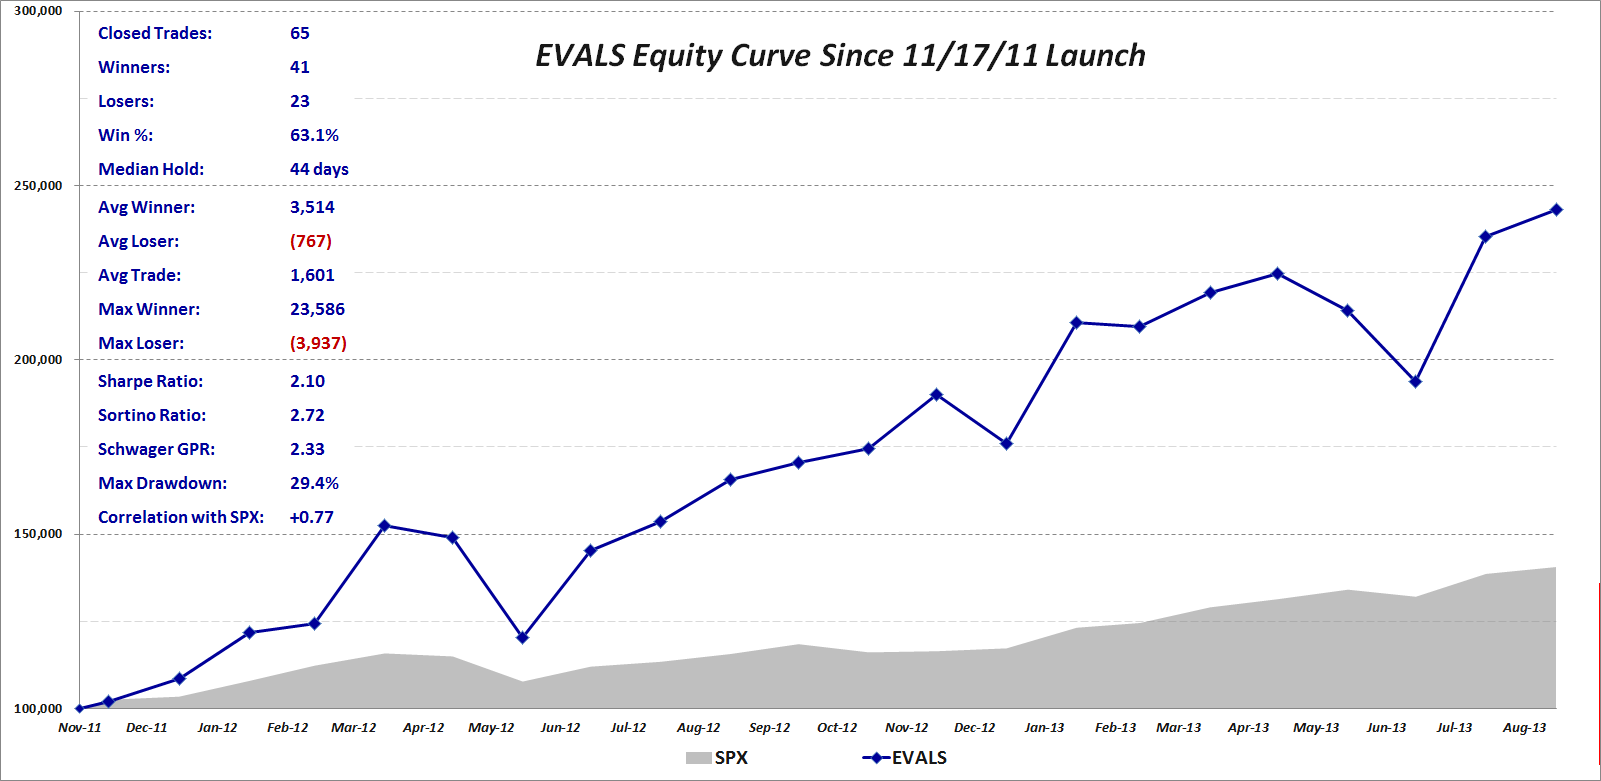
The two graphics below summarize the performance of the EVALS model portfolio since its launch on November 17, 2011 through yesterday’s close – a period that includes twenty full months and two partial months. In the 1 ½ months of 2011, EVALS gained 8.66%; for 2012 the return was 61.97%; and the year-to-date performance for 2013 is a gain of 38.18%. The total gains since inception are 143.21%, which is 102.62% better than the +40.58% performance of the benchmark S&P 500 index during the same period.
The equity curve graphic, which is based on a hypothetical model portfolio that began with $100,000 in November 2011 also includes some critical EVALS performance and trading data. These numbers point to a median holding period of 44 days, a win percentage of 63.1%, and an average winning trade that is 4.58 times larger than the average losing trade.
For those who may be interested in risk-performance data, I have also calculated the Sharpe ratio (2.10), Sortino ratio (2.72) and Schwager Gain to Pain ratio (2.33). The maximum drawdown remains the 29.4% peak-to-trough decline during the second quarter of 2012. One surprising number is the continued relatively high correlation between EVALS and the SPX of +0.77. This phenomenon is explained largely by the fact that since November 2011, the market environment for stocks has been considerably more bullish than bearish, so there have been quite a few months in which EVALS and the SPX have both posted gains.

[source(s):VIX and More]
The graphic below summarizes the same data in the form of monthly returns for EVALS in the top table and the performance of EVALS minus the SPX in the bottom table.

[source(s):VIX and More]
As a reminder, EVALS is a model portfolio that trades the full universe of VIX volatility ETPs on a long-only basis. The links below discuss the history, objectives and securities traded in the EVALS (virtual) model portfolio, which employs a very aggressive approach to trading volatility.
Please note that going forward, I will no longer be publicly updating EVALS performance data due to a variety of factors related to the launch of my new investment management business. I will continue to offer the EVALS model portfolio service (details below) and will be pleased to discuss current performance data privately. Also, as soon as the launch of my new investment management business is finalized, I will highlight some of the particulars in this space.
[Pricing for EVALS is $60 per month or $600 per year. For those who are interested in subscribing, just click on the Subscribe button on the upper right hand corner of the EVALS blog to subscribe via PayPal or email me at bill.luby[at]gmail.com if you wish to pay for an annual subscription with a personal check. There is no free trial associated with EVALS, though subscribers to the VIX and More newsletter (which does include a 14-day free trial) will certainly get a flavor of how I think about VIX-based ETPs.]
Related posts:
- EVALS Q4 2012 Update: Up 61.97% for 2012 and 76.00% Since the November 2011 Inception
- EVALS One-Year Summary and Performance Update (+74.13%)
- EVALS Q3 Update: Up 70.59% Since November 2011 Inception
- EVALS Q2 2012 Update
- EVALS Q1 2012 Update
- EVALS Relaunches, Now Focusing on VIX Exchange-Traded Products
Disclosure(s): none

1 comment:
Would you update this portfolio perfomance, please, Bill, or is it no longer going ?
Post a Comment